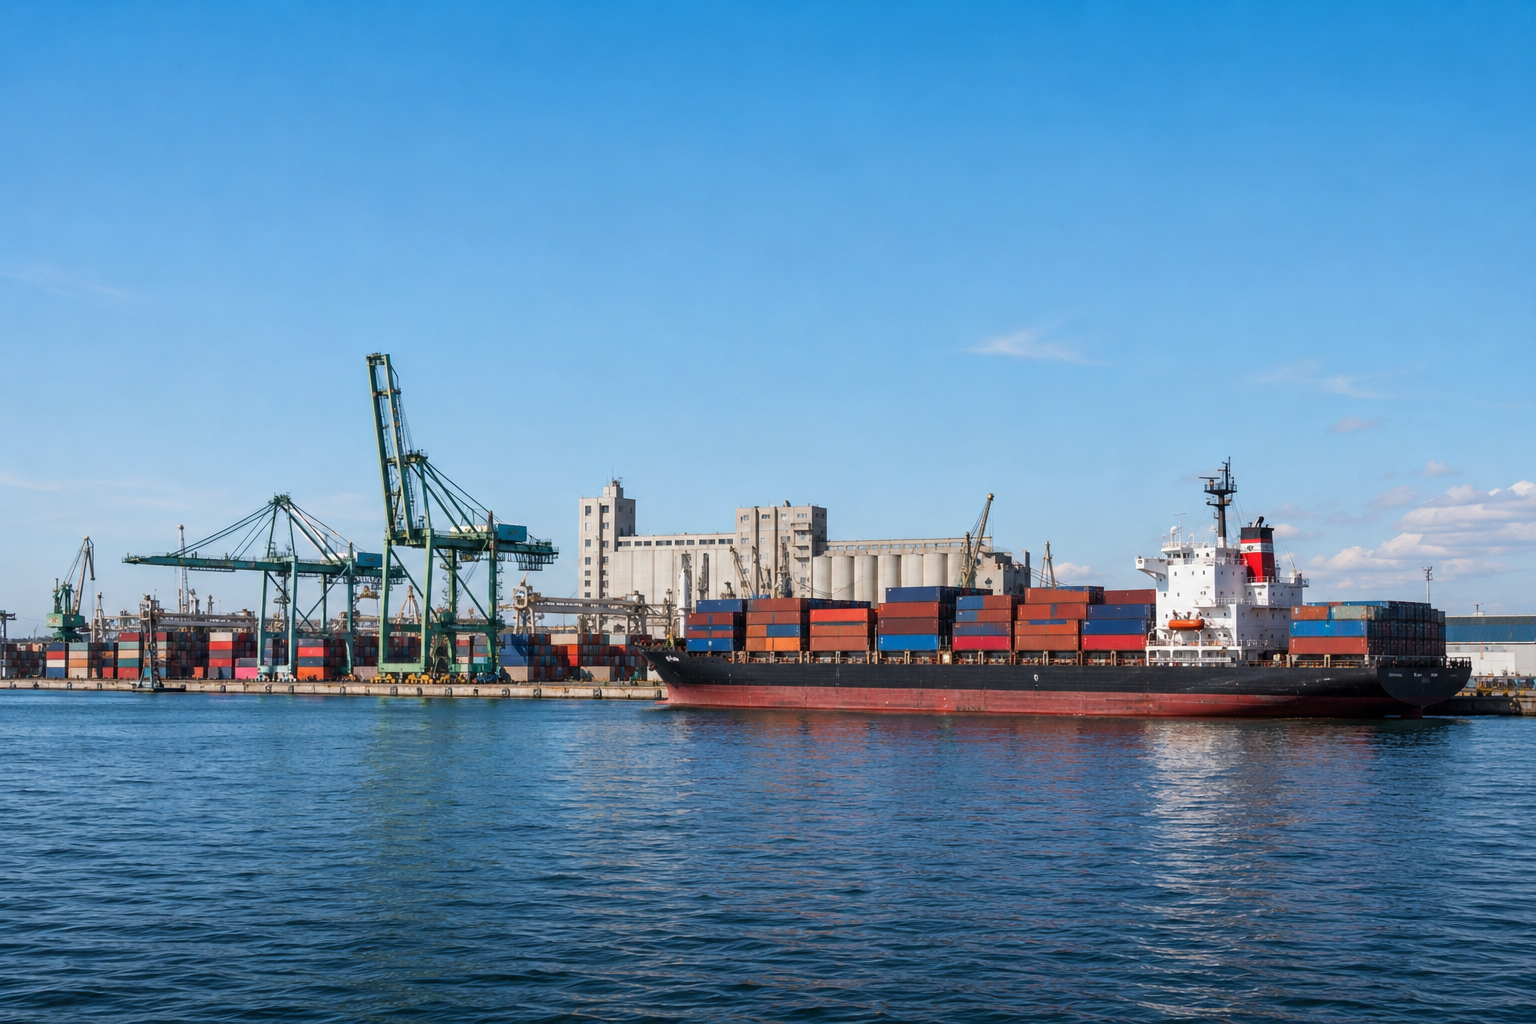
Why port planning fails without simulation

Container terminals are among the most complex logistics systems in the world. Vessel arrivals are stochastic — subject to weather, port congestion and carrier schedule changes. Quay crane productivity depends on vessel stow plan quality, hatch sequencing and the availability of yard transport. Yard density affects RTG cycle times, which feed back into berth turnaround, which affects the next vessel arrival window. These feedback loops are invisible in static capacity calculations.

Terminal operators facing a berth utilisation problem often invest in additional quay cranes, only to find the constraint moves to yard transport or gate throughput. Port authorities planning a new terminal extension calculate theoretical TEU throughput from berth length and crane rates, but cannot predict how the extension interacts with existing operations under variable vessel arrival patterns. Simulation captures all of this interaction before the first euro is spent.

The constraint moves: Terminal throughput is determined by the weakest link across berth, yard, transport and gate — and that link changes with traffic mix and volume. Simulation finds it before capital is committed to the wrong intervention.

The terminal zones we model

🚢 Berth & quay

  • Vessel arrival & berthing (stochastic)
  • Berth allocation strategy
  • Quay crane assignment & shifts
  • Hatch sequencing & twin-lift productivity
  • Vessel turnaround time

🚛 Horizontal transport

  • Straddle carrier & reach stacker fleets
  • Terminal tractor & chassis pools
  • AGV / automated shuttle systems
  • Travel time & conflict modelling
  • Fleet sizing optimisation

📦 Yard operations

  • Block layout & density management
  • RTG / RMG scheduling
  • Dwell time by container type
  • Rehandling rate prediction
  • Reefer & dangerous goods areas

🚗 Gate & intermodal

  • Truck arrival profile & queuing
  • Gate lane throughput & OCR
  • Rail terminal interchange
  • Barge feeder scheduling
  • Pre-gate & truck appointment systems

How a terminal simulation project runs

1

Terminal data collection

We collect vessel call history (arrival times, LOA, TEU), crane productivity logs, yard equipment fleet data (MTBF/MTTR), dwell time distributions by container category, and truck gate transaction times. AIS vessel data can supplement operational records where available.

2

Model build & validation

The simulation is built in AnyLogic — the industry-standard platform for port and terminal modelling. We validate the model against 12 months of historical berth utilisation, crane moves per hour and vessel turnaround data before running any scenario.

3

Scenario experiments

Investment and operational scenarios — additional berths, crane upgrades, fleet changes, gate automation, appointment systems — are tested as automated experiments. Each scenario produces throughput, utilisation, turnaround time and congestion statistics.

4

Investment brief & model handover

You receive a ranked investment brief with quantified throughput and cost impact per scenario, plus the executable model for ongoing planning use. Terminal planners can reuse it for annual traffic forecasts and new service calls without our involvement.

What you get at the end

Identified
true binding constraint — berth, yard, transport or gate — at each traffic volume
Ranked
investment options with throughput, turnaround and cost impact per scenario
Live model
reusable for annual planning cycles and new service call evaluation

Simulation vs analytical terminal planning

Planning questionSimulation modelAnalytical capacity model
Berth utilisation under bunching✓ Stochastic arrivals — bunching captured fully✗ Assumes uniform arrival intervals
Yard transport fleet sizing✓ Integrated with crane and yard cycle timesEstimated separately — no interaction
Gate congestion under peak arrival✓ Truck arrival profile modelled stochastically✗ Average throughput only
Expansion investment sequencing✓ Each phase evaluated at intermediate traffic volumes✗ Only steady-state target capacity
New crane type ROI (e.g. twin-lift)✓ Productivity gain in context of full terminal cycleCrane rate only — no downstream effect

Tools & technology

AnyLogic is the globally dominant platform for port and terminal simulation, used by the world's largest terminal operators and port authorities. Its agent-based engine handles the complex interaction between discrete vessel events, continuous equipment flows and stochastic arrival patterns that terminal modelling requires. For specialised studies — crane scheduling optimisation, barge window planning — we supplement with Python optimisation models that feed back into the simulation.

AnyLogic AnyLogic Port Library Python (optimisation) AIS data integration Simio

We have worked with container terminals ranging from 200,000 TEU/year regional ports to multi-berth deep-sea terminals. Models include combined vessel/yard/gate systems and specialised studies of individual terminal zones where a focused answer is needed quickly.

Case study

Regional container terminal
avoided €14M crane investment — simulation showed gate was the real constraint

AnyLogic port simulation model showing container terminal with quay cranes and yard operations
Container Terminal · AnyLogic

Finding the real throughput constraint before ordering cranes

A regional container terminal in Northern Europe was planning to purchase two additional quay cranes at a total cost of €14M to address throughput complaints from shipping lines. Analysis of berth utilisation figures suggested crane productivity was the bottleneck. Management wanted independent validation before committing to the procurement.

We built a full terminal simulation in AnyLogic, calibrated against 18 months of vessel call data, crane productivity logs and truck gate transaction records. The model revealed that quay crane utilisation was only 61% — well below the apparent constraint — because truck gate queuing was delaying import container releases and creating yard density spikes that impaired RTG productivity.

Crane purchase deferred — simulation showed available crane capacity was sufficient
Gate appointment system implemented — truck arrival spread reduced queue peaks by 38%
Throughput target reached at €1.2M gate automation cost vs €14M crane investment

Note: figures are illustrative. Replace with your own project results before publishing.

View all examples →
FAQ

Common questions about
port & terminal simulation

We cover container terminals (deep-sea, feeder and regional), intermodal rail-port terminals, Ro-Ro terminals, and bulk material handling terminals. The modelling approach differs by terminal type — container terminals require tracking individual container dwell and grading logic, bulk terminals focus on continuous flow rates and stockpile management — but the underlying AnyLogic platform handles all types.
Yes. Automated terminal equipment — AGVs, ASCs, automated gate systems — is one of the most valuable simulation use cases because the interaction effects are substantial. AGVs change the handshake logic with quay cranes, ASCs change yard density and crane cycle time. We model the full automated terminal cycle including control logic, failure modes and the transition from manual to automated operations during the changeover phase.
Vessel arrivals are modelled stochastically using fitted distributions derived from historical AIS and port call data. This captures bunching — multiple vessels arriving within the same window after weather delays — which is the primary cause of berth utilisation spikes that static models miss entirely. The model produces arrival scenarios at 5th, 50th and 95th percentile congestion levels.
Yes — and this is a particularly high-value application. We model the terminal at each phase of the expansion (Phase 1, Phase 2, full build-out) and at intermediate traffic volumes to identify when each investment phase becomes necessary. This prevents premature investment and ensures each phase is sized for the traffic volume it will actually serve, not just the ultimate target.
Terminal layout (berth positions, yard block configuration, gate lanes), at least 12 months of vessel call data (arrival time, vessel size, moves handled), crane productivity records, yard equipment fleet list with availability data, and truck gate transaction time samples. AIS data can supplement operational records. We can start with partial data and build up — early model runs often identify which data gaps matter most for the decision at hand.
Yes — and this is how most terminal clients use it. After the initial project, the model is handed over with documentation and a scenario runner interface. Terminal planners load the annual vessel call forecast and test scheduling changes, new service calls or equipment additions independently. Updates to the model (new berths, changed equipment) are typically straightforward and can be done in-house or via a small follow-on engagement.
Free consultation

Let's talk about your terminal

Tell us your terminal type, current throughput and the planning question you need answered. We'll tell you honestly whether simulation adds value and what the project would involve.

Response within 1 business day
Full NDA available as standard
Remote delivery worldwide
Transparent fixed-scope proposal

Germany — Dresden

Anton-Graff-Str. 24, D-01309
dresden@simulatefirst.com
+49 (0) 351 30906020

Poland — Wrocław

ul. Powstańców Śląskich 5, 53-332
polska@simulatefirst.com
+48 75 6406434

We respond within 1 business day · NDA available · No spam, ever

By submitting, your data will be used solely to respond to your enquiry. Privacy policy.